Using JavaScript with the Google Earth Engine API for ocean data visualization provides significant advantages. Firstly, it enables instant access to vast amounts of data, measured in millions of terabytes, without the need for local computations. Additionally, the API allows for convenient filtering of datasets based on specific spatial and temporal criteria. Another advantage is that all the datasets within the API follow a consistent structure, facilitating ease of use.
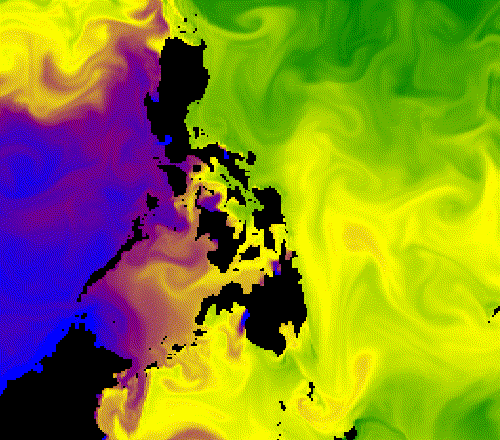
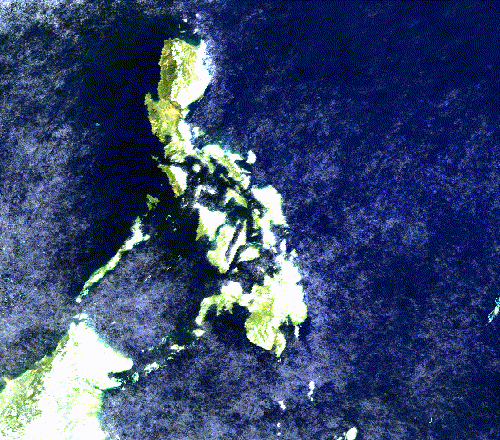
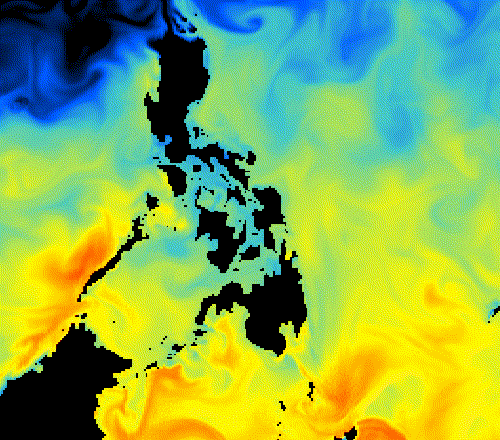
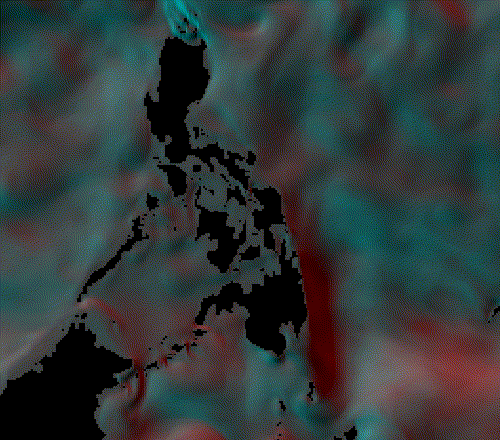
In my self-guided learning process, I acquired skills to generate dynamic animations illustrating various aspects of ocean data, such as temperature, salinity, velocity, and movement.